Sample Masters Merit Business Essay
See for yourself why we're a leading academic writing company. One of our expert writers has created this bespoke sample Business essay that shows the quality of writing that's guaranteed with every piece of work ordered. Secure your academic success and place an order today or view our Essay Writing Service.
A comparison of the U.K and US with regard to the return of industrial and commercial productivity, to inform investors on market conditions.
Introduction
This brief discourse examines the significant political and economic developments in the US and the UK in 2016 and their prospects for a sustainable economic recovery in the coming years. In 2016, both countries underwent significant political developments that created significant uncertainties with regard to economic policy moving forward. For the UK, this development involved the Brexit referendum, while in the USA it was the election of Donald Trump and reversal of the party in power from Democrat to Republican. Each of these major political developments were unexpected occurrences to which the financial markets reacted suddenly and dramatically. Each was preceded by dire predictions of new rounds of economic crises and unpredictability. Today, one full year has passed since these events have taken place, and the sudden knee-jerk reactions in the marketplace have given way to a cautious stability that is seeking confirmation about the direction the economy shall trend.
Purpose and methodology
The goal of this discussion is to provide a concise yet well-founded insight into the comparative growth in productivity that will likely sustain the US and UK economies. The perspective is one that may inform investors contemplating entry into these economies. The discussion will be guided by an examination of the leading indicators that are commonly referred to by analysts in constructing their forecasts for the economy. Four indicators shall inform the analysis – i.e. manufacturing and construction trends, the stock market index, employment and wages, and real estate valuations. The trend of these variables provide a reliable clue concerning the future direction of the economy (Baumohl, 2012; Karabell, 2014; Furgang, 2011).
UK's economic performance as of 2017
During the years 2008 to 2013, the UK was plunged into a deep and prolonged recession; but from 2013 onwards, the country had been experiencing a robust economic recovery, outperforming many of the G7 countries, which it led together with Germany. On the 23rd of June, however, the majority of the electorate in the UK voted to leave the European Union, causing the resignation of David Cameron as prime minister and former home office minister Teresa May to ascend in his place. The unexpected results caused volatility in the markets as investors and speculators sought to factor in the repercussions of the exit from the EU. Because of the general expectation that Britain would vote to stay in, there had been little planning or forecast for a Brexit scenario.
If you need assistance with writing your essay, our professional Essay Writing Service is here to help!
Find out moreManufacturing and construction trends
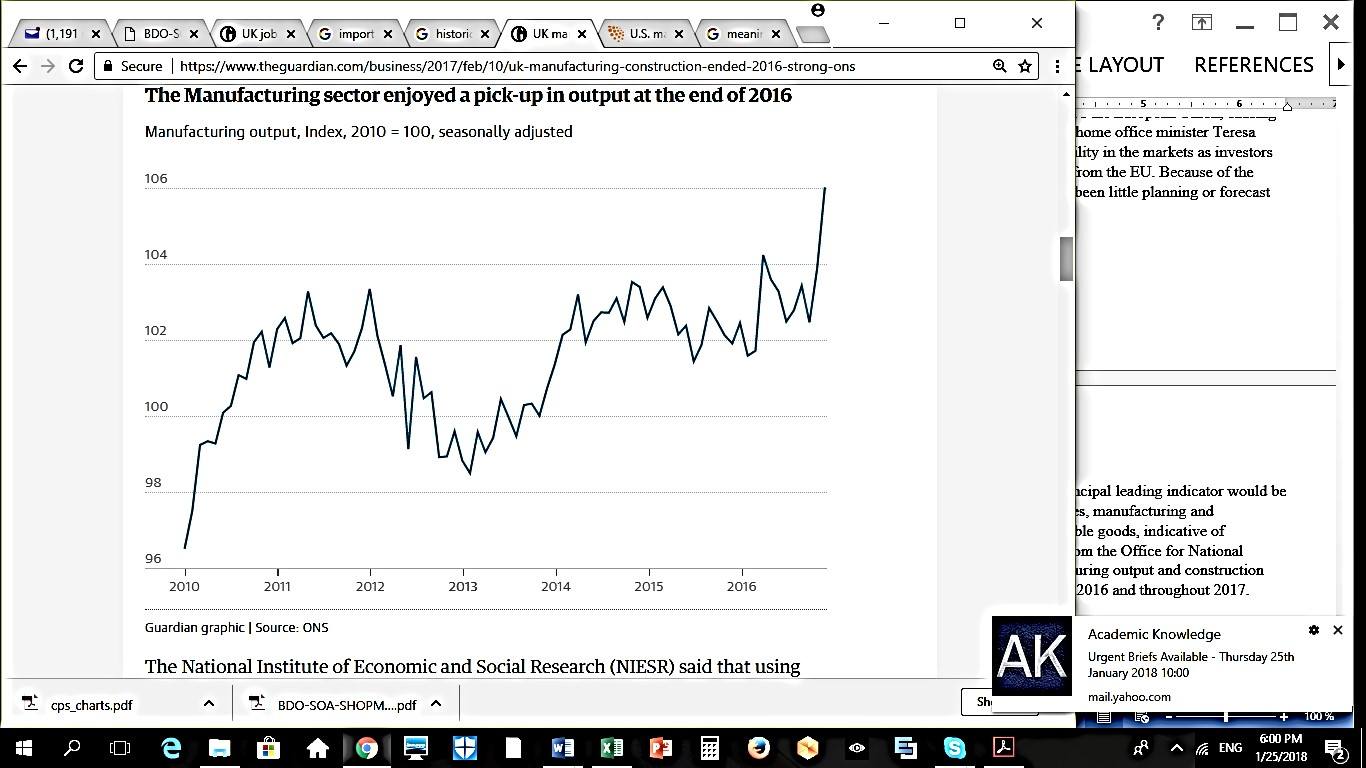
In order to determine productivity trends in an economy, the principal leading indicator would be the development of production capacity in the principal industries, manufacturing and construction. These represent the creation of consumer and durable goods, indicative of expanding long-term demand and consumer confidence. Data from the Office for National Statistics (ONS) shows that in spite of the Brexit vote, manufacturing output and construction projects registered strong growth even within the last months of 2016 and throughout 2017. The ONS calculated manufacturing output to have grown by 4% for the year, accounting for 10% of GDP (Allen, 2017).
Stock market performance
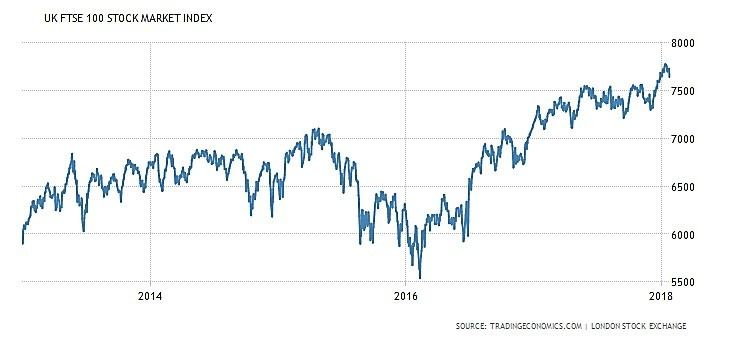
The stock market index is an indication of the sustainability of capital formation upon which businesses may rely on for long-term financing. The following table shows the FTSE 100 which represents roughly 80% of the market capitalisation of the London Stock Exchange (Eckett, 2015; Hobson, 2011). The graph of the FTSE 100 index shown below indicates that it has reached its bottom just after the start of 2016, indicating that negative information had already been discounted at the time of the referendum. From thence, investors had been accumulating undervalued stocks, treading at a resistance through most of 2017 and breaking out thereafter. This indicates more optimism in 2018 and after.
Real estate valuation
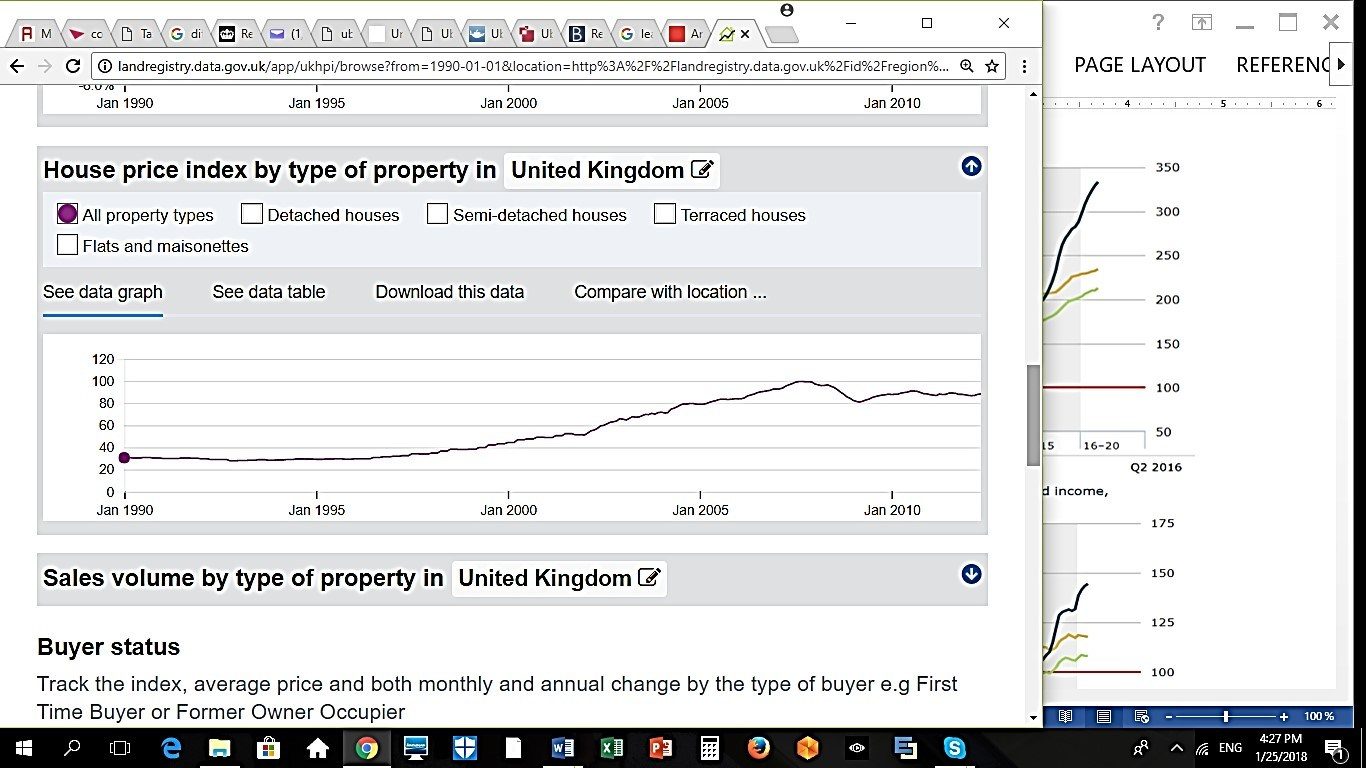
Investment in real estate is another indicator of growing optimism and long-term demand in the economy. Unlike the US markets where property values fell drastically, UK real estate was not as adversely affected, although there appears to be evidence of a bubble in valuations for 2008. The crisis brought a 20% correction, which was not however very deep, after which property values recovered after 2010 and remained stable towards 2017. Valuations will continue to remain stable, which is reassuring to investors contemplating entry into this type of asset.
Employment and wages
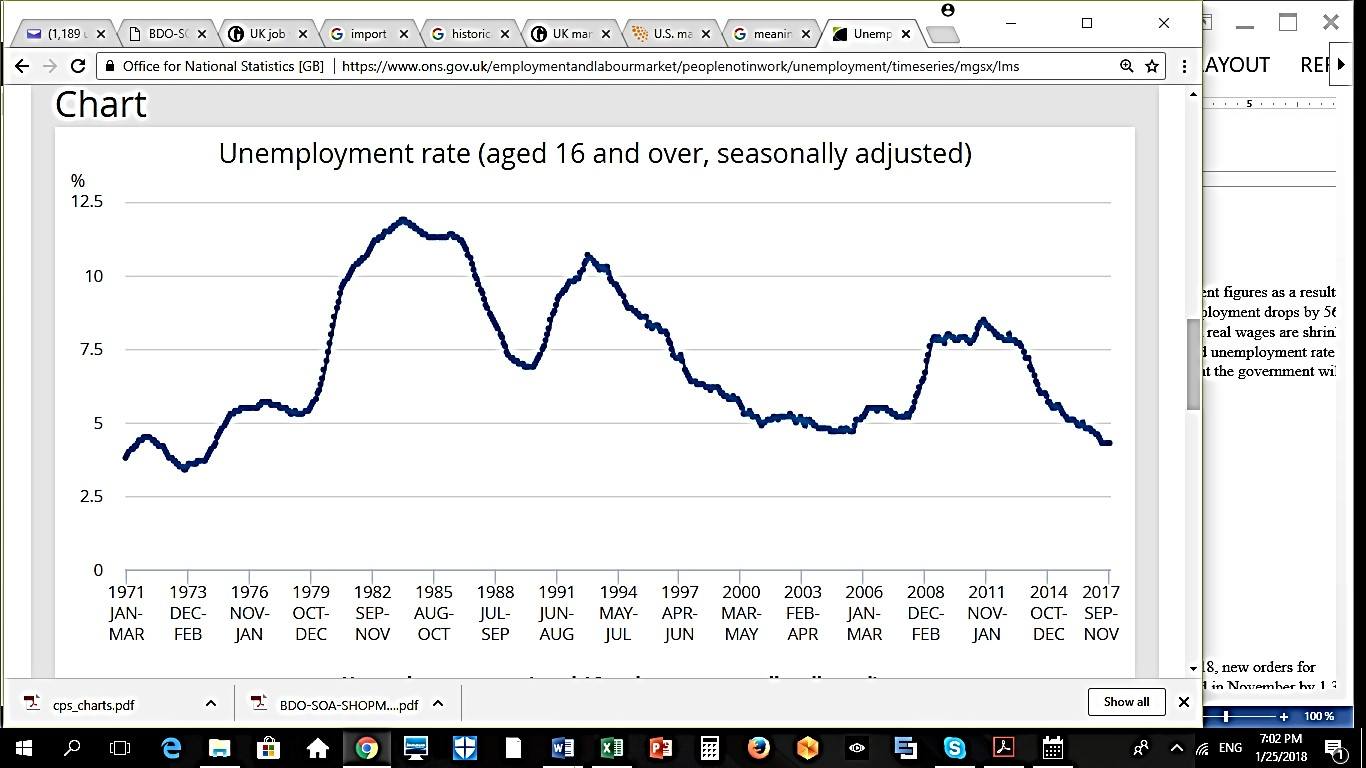
The UK labour market unsurprisingly registered lower unemployment figures as a result of the expansion of marketing and construction activities. Overall UK employment drops by 56,000 at the end of 2017, while basic pay growth increases to 2.3% although real wages are shrinking, Vacancies are at a record high as firms struggle to find workers, and the unemployment rate, currently 4.3%, remains at a 42-year low (Wearden, 2017). Shortage of skilled staff further pushes wages upward, although wage growth still lags behind inflation (Inman, 2018). The fully-engaged workforce also substantially contributes to national productivity and value creation.
USA's economic performance in 2017
On 8 November 2016, the United States elected its 45th president, and while the event was entirely expected, the winner was not. The victory of Donald Trump signalled a dramatic change in US policy away from the liberal social policies, high entitlement spending, and severely regulated business environment, and reversion towards a notably conservative regime that reins in social spending, reduces business regulation, reduces the size of government, and conducts a comprehensive reform of the tax system. While these are heartening developments for businesses, a radical exodus from multilateral trade agreements and preference for reliance on bilateral trade agreements tended to cause uncertainty among industries that rely heavily on imports and exports. Thus, while the new administration had been clear in the direction of its policies, the unorthodox methods and strategies of a non-traditional president has caused some nervousness among investors, at least for the first year.
Free Undergraduate Lectures
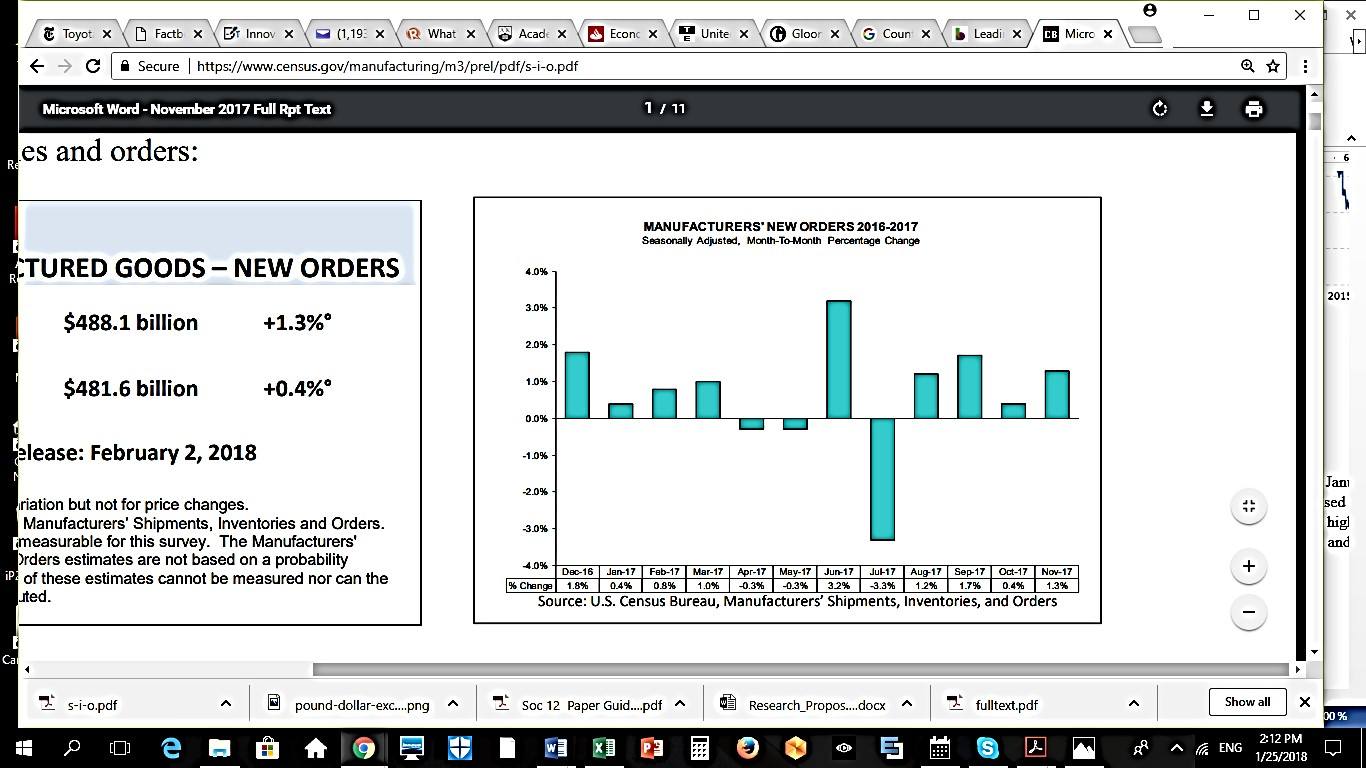
Manufacturing and construction trends
In the report released by the US Census Bureau dated 5 January 2018, new orders for manufactured goods were up five of the last six months. It increased in November by 1.3%, higher than the 0.4% in October. Other components likewise rose higher than previous months – shipments (1.2%), unfilled orders (0.1%), inventories (0.4%), and new orders for manufactured durable goods (1.3%). In short, productive capacity is undoubtedly building up at an accelerated pace as a result of eliminating 16 regulation for every new one (Bedard, 2017) and, towards the end of 2017, the passing of the Tax Cuts and Jobs Act of 2017. The reduction of corporate tax rates from 35% to 21% (Mulligan, 2017) provided a huge incentive for domestic and foreign businesses to set up production facilities in the US, and expand investments and spending.
Stock market performance
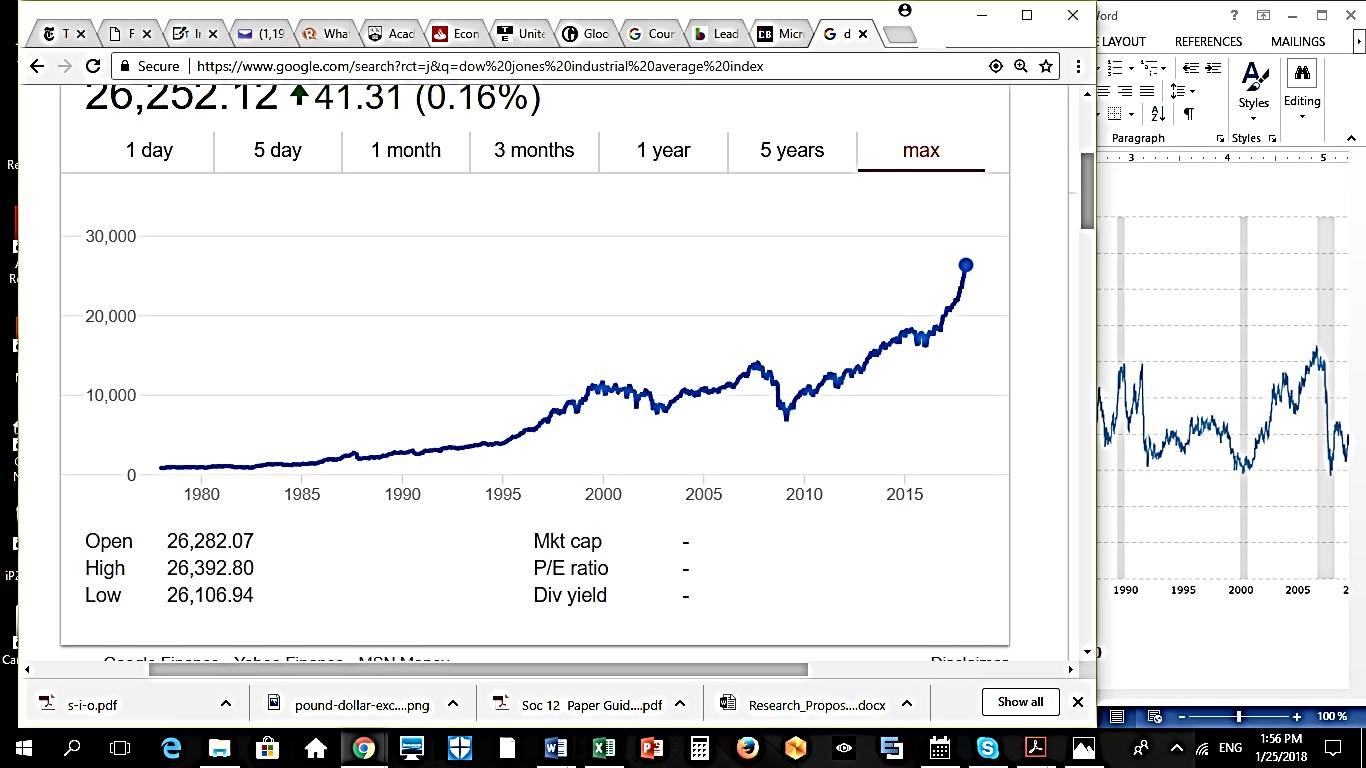
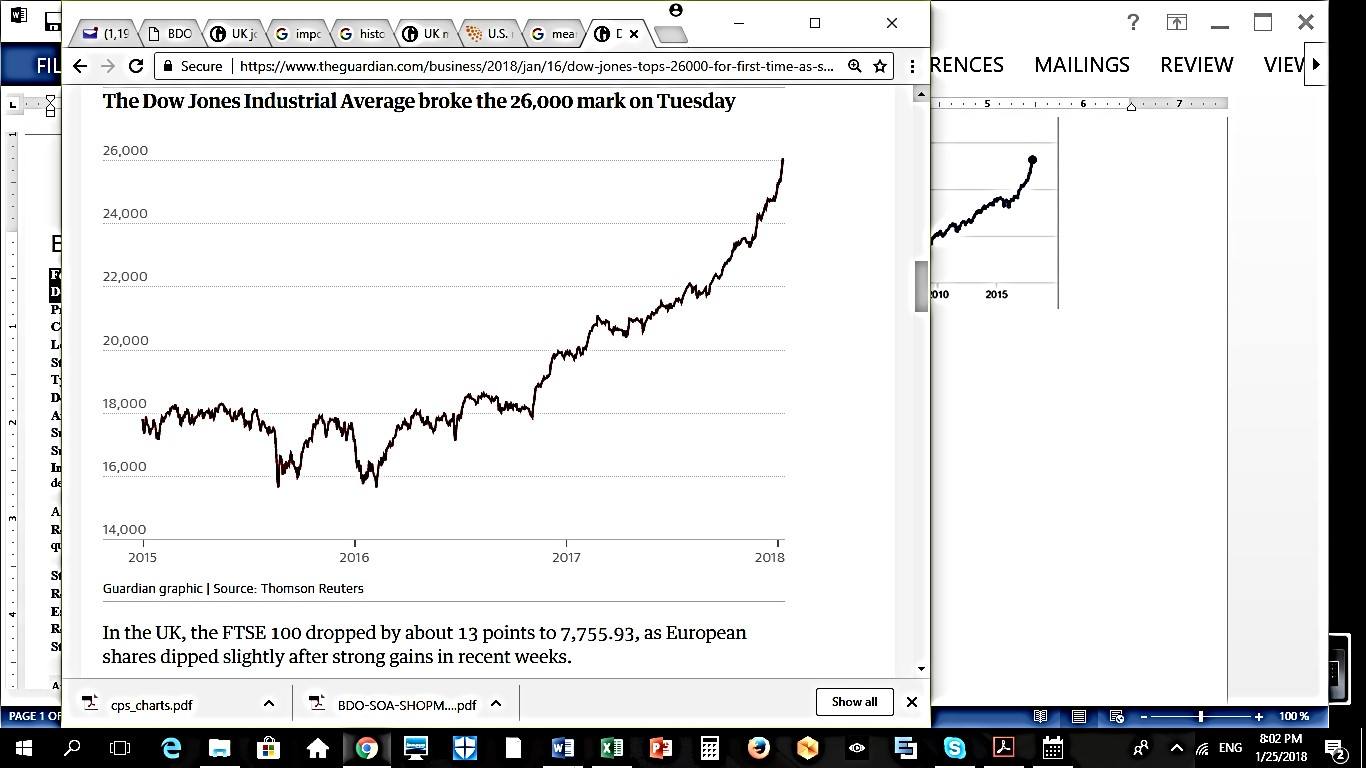
Much as the FTSE 100, the Dow Jones Industrial Average (DJIA), a broad market indicator for the equity capital availability, has been rising throughout 2017, although at a much more accelerated pace. From its severe dip during the 2010 financial crisis, the DJIA's rise had been gradually consistent though hesitant, losing momentum after a brief surge, and tentatively correcting towards year-end 2016 in anticipation of the uncertainties of the election. During 2017, however, the DJIA surged from 20,000 to the 26,000 level at the fastest pace in Wall Street history. The possibility of a stock market bubble are feared by some, but dispelled by others because of the low inflation, low interest rates, and increased productivity implying value creation matching asset price increases (Partington, 2018).
Real estate valuations
An indicator of investor sentiment towards long-term investments, the values of real estate in the US have risen from their deep attrition as a result of the 2008-2010 subprime mortgage crisis, and have now recovered to their pre-crisis levels in some areas of the country. The first figure below showing the price index indicates that this is true at least of San Francisco.
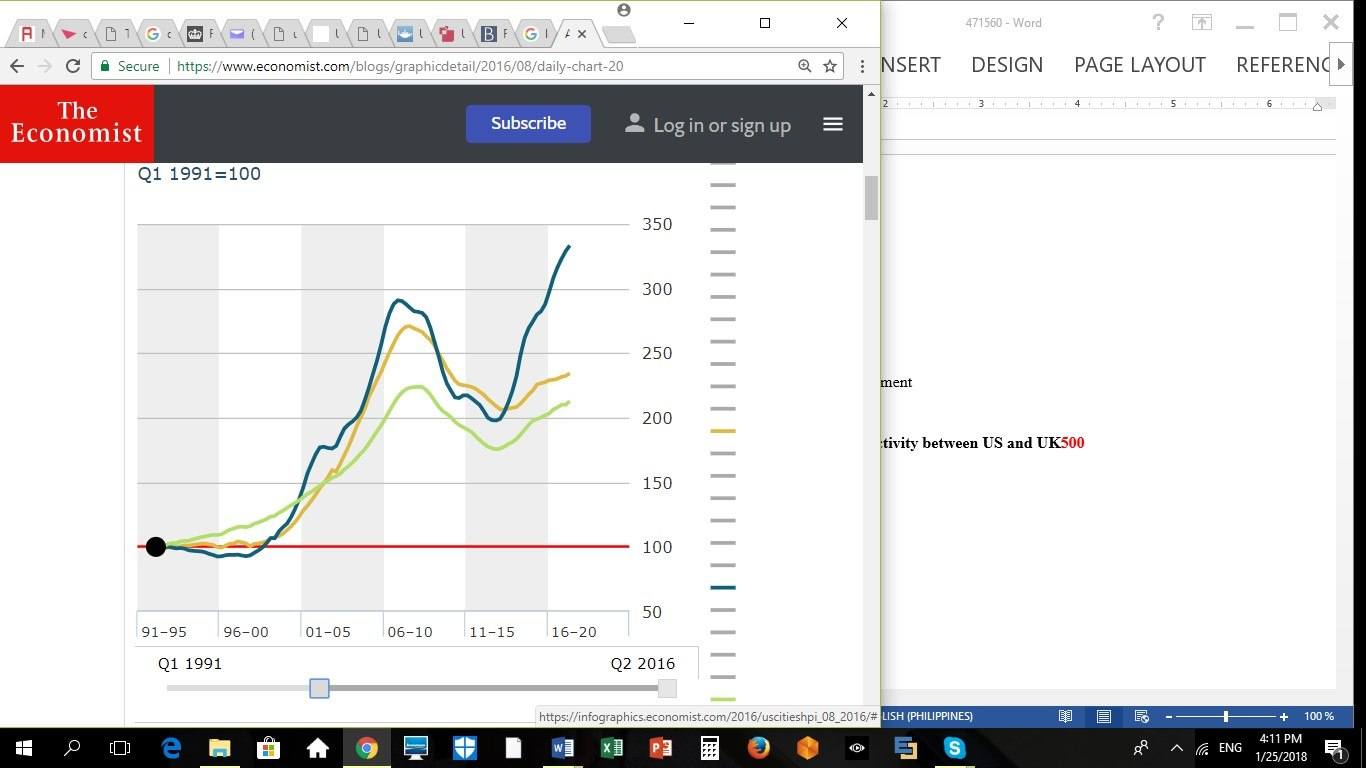
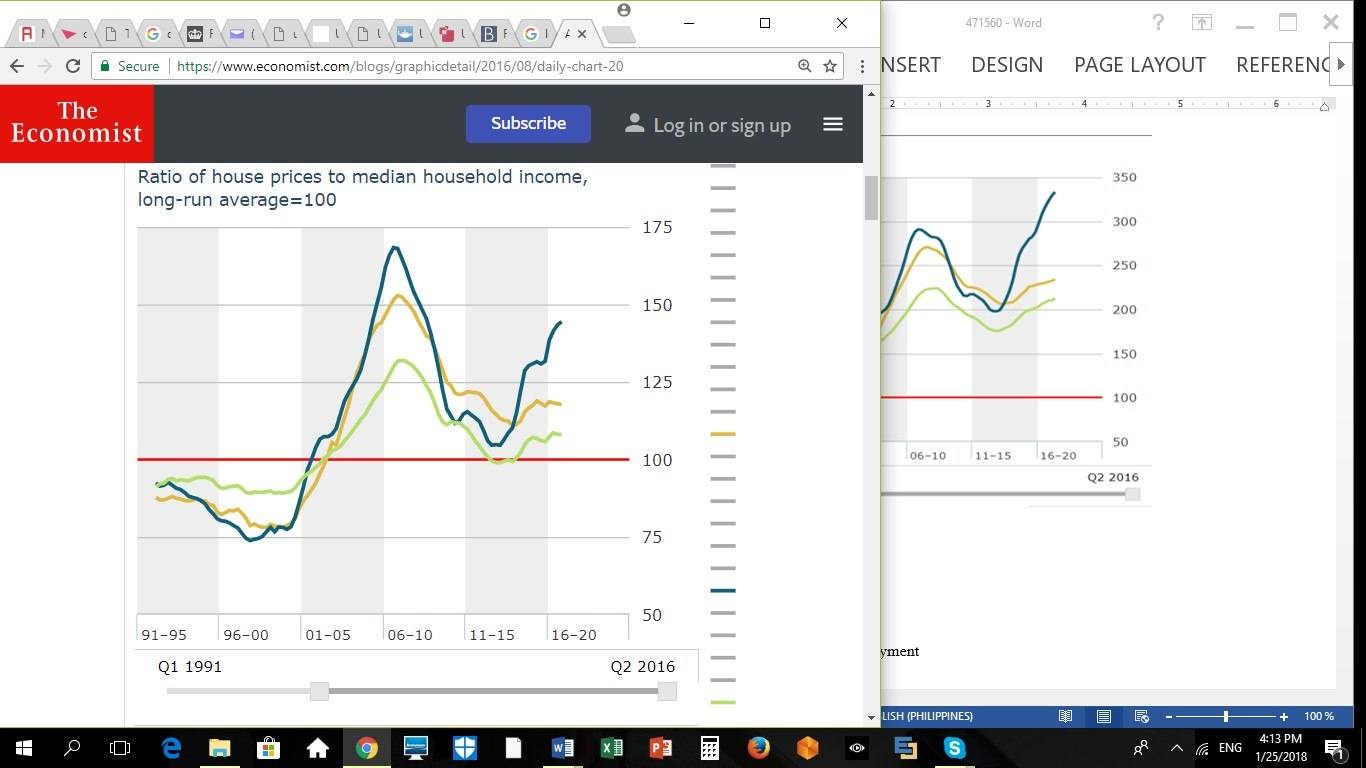
Blue – San Francisco; Yellow – New York; Green – United States
The phenomenal rise in these areas begs the question once more as to whether a crash is imminent. The second graph, which shows the ratio of house prices to median household income, indicates that despite the rise in prices, their comparative value to earning power remains far from the high proportions reached during the last crisis, indicating that there is still room for asset prices to rise without yet the likelihood that a bubble will occur.
Employment and wages
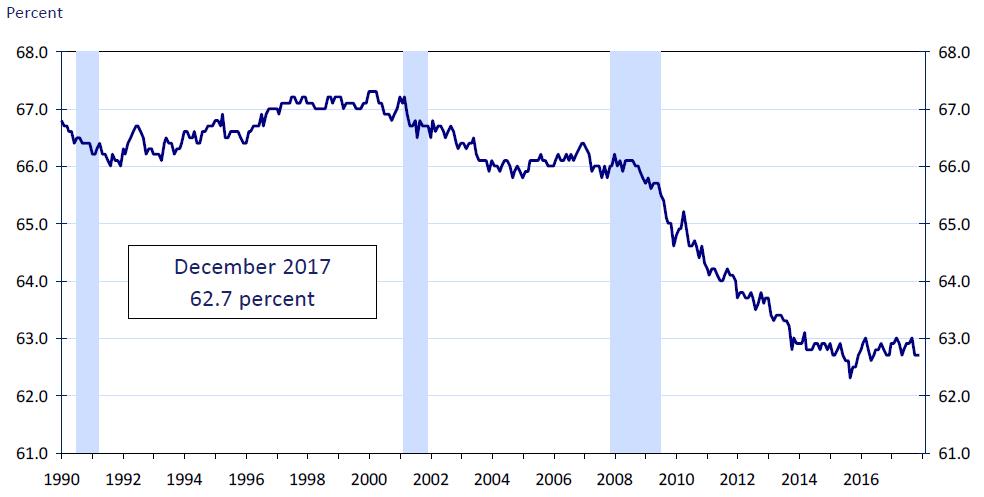
The graph below shows the US civilian labour force participation rate, with the blue shaded portions representing times of recession as determined by the National Bureau of Economic Research (NBER). The civilian labour force participation rate is the proportion of the economy's labour force that is currently active and employed, thus the higher the labour force participation rate, the greater the productivity of the population of employable age. The graph below shows that the participation rate fell significantly during the period 2009 to 2016, coinciding with the Obama regime that saw a record 95,102,000 Americans not in the labour force (Jones, 2017). Since the change of administration, however, participation rate had begun to recover.
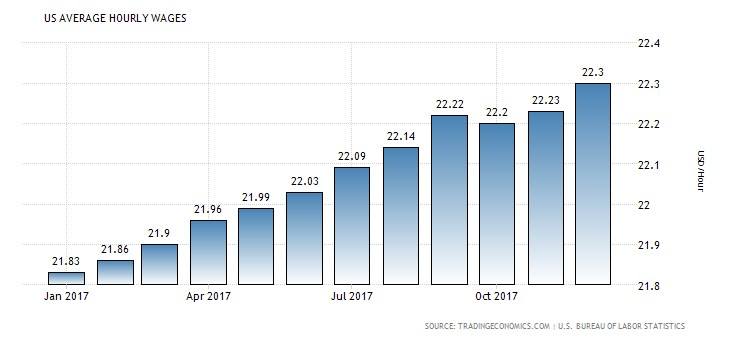
Wages have also begun to recover and rose continually throughout 2017, reaching a high in December, and promising to rise even more with the announcement of companies raising their rates as a result of the legislated tax cut passed by Congress and implemented at the start of 2018.
If you need assistance with writing your essay, our professional Essay Writing Service is here to help!
Find out moreComparing the US and UK
In 2016, both currencies (the pound sterling and the US dollar) dropped in value, however the pound fell farther than the dollar. After the Brexit vote, the pound fell to a 31-year low against the US dollar, which posed challenges as it placed upward pressure on prices and fuelled a growing uncertainty that dampened consumer spending (Macrotrends, 2018). Goods imported into the UK are acquired at a higher cost, which constrains manufacturing that relies on imported raw materials and supplies. However, lower exchange rates enable UK exports to be priced more competitively, creating an advantage for exporters.
The slight weakness in the pound against the dollar implies a slower recovery on the part of the UK (i.e. from the 2016 Brexit sell-off), but overall the analysis of the four leading indicators – trends in the manufacturing and construction sectors, the stock market indices, property prices, and employment and wages – suggest that both the US and UK economies have recovered from their short-term slumps and are poised to sustainably expand in their productivity and growth. It should be kept in mind that the causes for their economic weaknesses in 2016 differed in nature. For the US, it is largely an internal phenomenon, i.e. the uncertainty of regime change, while for the UK it is external, namely the change in the political and economic dynamics between the UK and the European Union.
Productivity and growth appear to be sustainable in both countries, because there exists room for increased productivity. They differ, however, in their rate of recovery. In the case of the US, the policy uncertainties are more speedily resolved because the new administration has the discretion to act swiftly or slowly, change or maintain policies, and manage national affairs within the internal governance structure. The UK does not have that luxury, needing instead to undertake slow and uncertain negotiations with the EU and other countries. In the US, economic recovery appears to have a greater momentum and clarity of direction than that of the UK. Presently, investors are boldly putting their stake in the robust US economy; they would, however, do well to move more gradually and deliberately in pursuing a UK investment strategy.
References
- Allen, K 2017 'UK manufacturing and construction ended 2016 on a strong note,' The Guardian. 10 February. Retrieved 21 January 2018 from https://www.theguardian.com/business/2017/feb/10/uk-manufacturing-construction-ended-2016-strong-ons
- Atradius 2017 'Market Monitor Consumer Durables United Kingdom, 2017.' Atradius. Retrieved 21 January 2018 from https://atradius.co.nz/reports/market-monitor-consumer-durables-united-kingdom-2017.html
- Baumohl, B. 2012 The Secrets of Economic Indicators: Hidden Clues to Future Economic Trends and Investment Opportunities. Upper Saddle River, NJ: FT Press
- Bedard, P. 2017 'Trump kills 16 regulations for every new one, crushing 2-for-1 goal,' Washington Examiner. 19 July. Retrieved 21 January 2018 from http://www.washingtonexaminer.com/trump-kills-16-regulations-for-every-new-one-crushing-2-for-1-goal/article/2629177
- Eckett, S. 2015 The UK Stock Market Almanac 2016. Petersfield, Hampshire: Harriman House Ltd.
- Furgang, K. 2011 Understanding Economic Indicators: Predicting Future Trends in the Economy. New York, NY: The Rosen Publishing Group, Inc.
- Hobson, R. 2011 Small Companies, Big Profits: How to make money investing in small companies. Petersfield, Hampshire: Harriman House Ltd.
- Inman, P. 2018 'UK job vacancies and numbers employed both hit record highs,' The Guardian. 24 January. Retrieved 24 January 2018 from https://www.theguardian.com/business/2018/jan/24/uk-employment-level-hits-joint-highest-since-1971
- Jones, S. 2017 'Record 95,102,000 Americans Not in Labour Force; Number Grew 18% Since Obama Took Office in 2009.' CNS News.com, 6 January. Retrieved 21 January 2018 from https://www.cnsnews.com/news/article/susan-jones/record-95102000-americans-not-labour-force-number-grew-18-obama-took-office
- Karabell, Z. 2014 The Leading Indicators: A Short History of the Numbers that Rule Our World. London: Simon & Schuster
- Land Registry 2017 'House Price Statistics,' UK House Price Index. Retrieved 21 January 2018 from http://landregistry.data.gov.uk/app/ukhpi/browse?from=1990-01-01&location=http%3A%2F%2Flandregistry.data.gov.uk%2Fid%2Fregion%2Funited-kingdom&to=2017-12-01
- Macrotrends 2018 Pound Dollar Exchange Rate (GBP USD) – Historical Chart. Retrieved 21 January 2018 from http://www.macrotrends.net/2549/pound-dollar-exchange-rate-historical-chart
- MarketSlant 2018 'S&P 500 Reversed Higher, No Fear Again,' MarketSlant. 18 January. Retrieved 21 January 2018 from https://www.marketslant.com/article/sp-500-reversed-higher-no-fear-again
- Mulligan, C. 2017 'At 21 or 20 percent, new corporate tax rate will boost US economy.' The Hill. 18 December. Retrieved 21 January 2018 from http://thehill.com/opinion/finance/365400-at-21-or-20-new-corporate-tax-will-boost-us-economy
- Mutikani, L. 2017 'U.S. manufacturing, construction sector shine as year ended.' Reuters. 3 January. Retrived 21 January 2018 from https://www.reuters.com/article/us-usa-economy/u-s-manufacturing-construction-sectors-shine-as-year-ended-idUSKBN14N1AM
- ONS 2018 'Unemployment rate (aged 16 and over, seasonally adjusted),' Office for National Statistics. Retrieved 21 January 2018 from https://www.ons.gov.uk/employmentandlabourmarket/peoplenotinwork/unemployment/timeseries/mgsx/lms
- Partington, R. 2018 'Dow Jones tops 26,000 for first time as stock market boom continues,' The Guardian, 16 January. Retrieved 21 January 2018 from https://www.theguardian.com/business/2018/jan/16/dow-jones-tops-26000-for-first-time-as-stock-market-boom-continues
- The Economist 2018 'American house prices: Reality check,' The Economist. Retrieved 21 January 2018 from https://www.economist.com/blogs/graphicdetail/2016/08/daily-chart-20
- Trading Economics 2018 'UK FTSE 100 Stock Market Index.' Retrieved 21 January 2018 from https://tradingeconomics.com/united-kingdom/stock-market
- Trading Economics 2018 'United States Average Hourly Wages,' Trading Economics. Retrieved 20 January 2018 from https://tradingeconomics.com/united-states/wages
- U.S. Census Bureau 2018 'Monthly full report on manufacturers' shipments, inventory and orders, November 2017.' US Census Bureau. Retrieved 21 January 2018 from https://www.census.gov/manufacturing/m3/prel/pdf/s-i-o.pdf
- US Bureau of Labour Statistics 2018 'Civilian Labour Force Participation Rate,' U.S. Bureau of Labour Statistics. Retrieved 20 January 2018 from https://www.bls.gov/web/empsit/cps_charts.pdf
- Wearden, G. 2017 'UK employment total drops, but pay growth picks up – as it happened,' The Guardian., 13 December. Retrieved 21 January 2018 from https://www.theguardian.com/business/live/2017/dec/13/uk-unemployment-report-pay-growth-labour-market-business-live?page=with:block-5a30f80332ead406c97165cf#block-5a30f80332ead406c97165cf
- Yahoo Finance 2018 Dow Jones Industrial Average. Retrieved 21 January 2018 from https://www.google.com/search?rct=j&q=dow%20jones%20industrial%20average%20index
Cite This Work
To export a reference to this article please select a referencing style below: