HEC-HMS Evaluation
| ✅ Paper Type: Free Essay | ✅ Subject: Environmental Studies |
| ✅ Wordcount: 1698 words | ✅ Published: 04 Sep 2017 |
HEC-HMS is a hydrological model that can be used to check the effect of a storm based event on a watershed or a continuous simulation. HEC-HMS is distributed model but it deals with a watershed as a conceptual model which consist of sub-basin and reach. HEC-HMS is very powerful as it has many options for hydrological calculations and a user-defined is one of the options. One of the uses of the HEC-HMS is to predict the future urbanization that can happen in a watershed and the corresponding flood that could happen. HEC-HMS alone cannot get the places of the flooded area but the hydrograph extracted from the HEC-HMS can be used in HEC-RAS and RAS-mapper to get the inundated map of the city due to a certain storm event. In this lab, a simple simulation will be used to simulate the hydrograph of Tifton watershed.
In order to build a HEC-HMS project, there are components should be added first. The main components that the HEC-HMS require is the basin component which contains the basin properties such as sub-basins, reaches and junctions, the metrological component which contains the rain gages that will be used for precipitation, the control component which contains the simulation time period and the time series component which contains any time series data such as the hyetograph or hydrograph.
HEC-HMS has four main windows which are the component window, view window, editor window and message log window. The component window contains all the created components so that we can toggle between them. In order to edit any of the components chosen from the component window, the editor window is used and it contains tab but for global data entry or edit the component menu is used. The view window shows the selected basin, result or table. The log message shows if there is error or the model has found no problem as for example as shown in Figure 1 the log message says, “Note 10008: Finish opening project….” Which means that the project was opened successfully with no errors found.
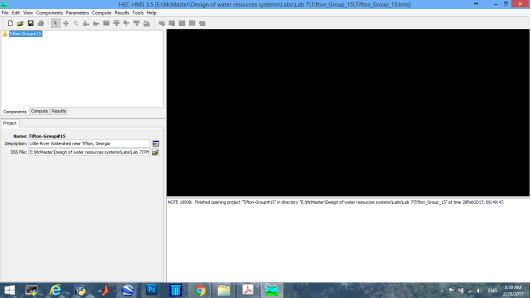
Figure 1 Log message of HEC-HMS
Basin component
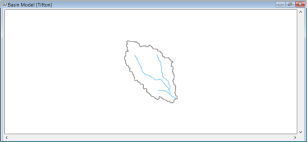
As mention before that the HEC-HMS is conceptualizing the watershed, so we will import the watershed image as a background as shown in Figure 2 and draw on it the corresponding component. This is a simple watershed that contains only one sub-basin and one outlet. the sub-basin is named 74006 and the outlet is junction in HEC-HMS and there is no reach used for flow channel routing.
The sub-basin properties should be entered for HEC-HMS to use in calculations. The main property is the catchment area as the HEC-HMS is using all the catchment symbolled in one point (sub-basin 74006). The other properties that should be entered are the hydrological calculations that the HEC-HMS will use to calculate the hydrograph at the outlet of the sub-basin as shown in Figure 3.
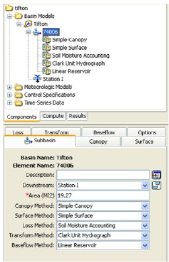
Figure 3 Sub-Basin hydrological calculation methods
Canopy is the method used to calculate the water intercepted on the tree that avoid the water to reach the ground. The percentage of vegetation obtained from remote sensing is used to determine the canopy. In this lab, simple canopy method is used which need only the initial water storage in the tree and the maximum storage that the plant can hold.

In order to indicate the surface storage that can happen in the watershed there are different methods, in this lab a simple surface is used. The simple surface method is mainly saying how much is the initial storage and the maximum storage. The maximum storage provide in this lab is zero which is useless as the surface method can be selected as none instead. To get the parameters of the initial storage and maximum storage a site investigation can be done or throughout satellite maps and DEM the surface depletions and storage area can be calculated roughly.
Infiltration losses is indicated here as the loss method. The loss method that is widely used is the Horton equation but in this lab the soil moisture loss is used. The soil moisture loss method mainly works as the soil moisture content and the maximum infiltration rate of the vadous zone of the soil as well as the groundwater beneath the vadous zone depth and the percolation rate from vadous zone to the groundwater and if the groundwater is into two different soil type provide the data to each soil type. In order to get the data for this method a soil surveying is required or from a previous defined data as the FAO maps or Canada CIRUS maps.
The unit hydrograph for the basin is not known so a synthetic hydrograph will be used. There are different synthetic hydrograph methods in HEC-HMS, in this lab Clark (1945) Hydrograph is used. The Clark Unit Hydrograph is divided into translation based on synthetic time area curve and time of concentration as well as a reduction of discharge as excess rainfall is stored in watershed. Clark Unit Hydrograph is modeled with linear reservoir for baseflow. The parameters for the Clark Unit Hydrograph is the time of concentration and the storage coefficient. Time of concentration can be calculated using watershed properties or from previous observations but the storage coefficient most likely will be calibrated.
The linear reservoir is used for baseflow separation. Baseflow is linearly related to average storage of each time interval similar to the Clark unit Hydrograph. The linear reservoir also is used with the soil moisture content as it depends of the water in the groundwater and how it returns back to be a contributed to the hydrograph as a baseflow. The parameters of the baseflow is hard to measure so it will be most likely calibrated.
Time series component
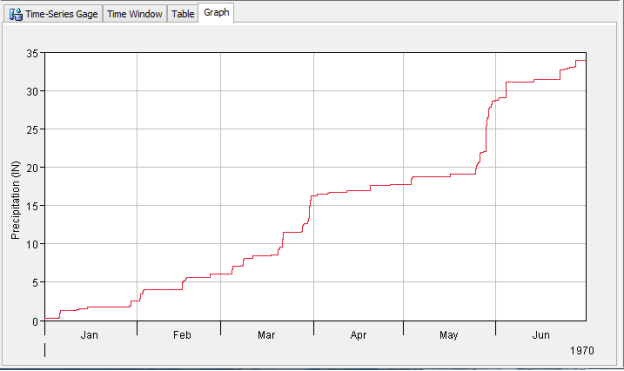
In the time series component, a rainfall hyetograph is entered in the rain gages using the Tifton DSS file provided with the project. After entering the hyetograph, the graph can be shown as shown in Figure 4. The hyetograph will then be assigned to the basin in the metrological compenent.
In the time series component, also the observed outflow hydrograph of the catchment is entered using the Tifton DSS file. After entering the DSS file the hydrograph is shown as in Figure 5. The hydrograph should be used for model calibration of the unknown parameters.
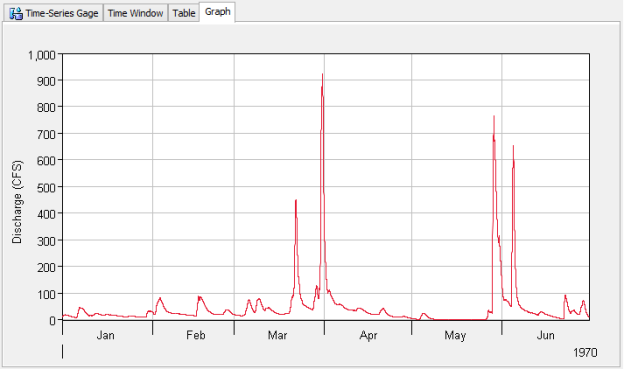
Figure 5 Tifton observed hydrograph
Meteorological component
In the meteorological component, the hyetograph is assigned to the sub-basin and if there are more than one rain fall gage a weighted average can be assigned to each sub-basin. Also in the meteorological component, the evapotranspiration is entered. In this lab, monthly average is used which gives a constant value for each month and corresponding coefficient.
Control component
Finally, the control component is used to define the simulation period and time interval. In the lab, according to my group number which is 15 the corresponding simulation time is used which is from the first of January 1970 to the thirties of June 1970.
After finishing all the data entry, a simulation manager is used to create a simulation which is defined by selecting the basin, meteorological and control data to be computed. After creating the simulation, compute is chosen and a message of successful appear in the message log -if there is any error or warning will appear in the message log too-.
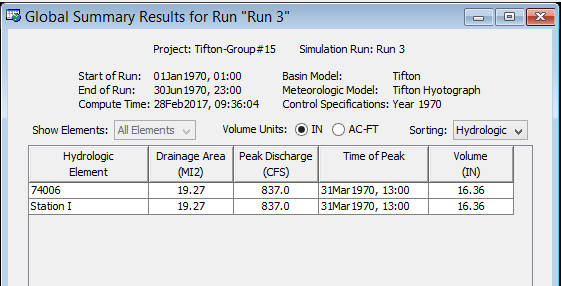
From the results tab, a global summary can be viewed as shown in Figure 6. The global summary gives the drainage area contributing to each sub-basin and each junction and the time to peak and the corresponding peak discharge as well as the total volume of excess rainfall. In this lab, there is only one sub-basin so the sub-basin and junction will have the same properties. The peak discharge is 873 CFS and happened in the thirty-first of March 1970 at 1:00 PM. The total excess volume is 16.36 in.
The graph of the sub-basin 74006 shown in Figure 7 show the hyetograph in the top part which consists of red and blue. The red part shows the infiltrated depth while the blue line shows the excess rainfall depth. The bottom part of the graph shows the hydrograph which consists of the baseflow and the excess hydrograph. The blue solid line shows the hydrograph while the dotted red line shows the baseflow. As we can see that in January all the rainfall is almost infiltrated and there is no excess and that is reflected in the hydrograph as there is no excess hydrograph only baseflow. The peak rainfall events happened at the end of March and May and as we can see that there is a lag time between the peak of the hyetograph and the hydrograph which represent the time of the water to route though the watershed to the outlet of the catchment. Even both event in March and May has the same rainfall but the peak was higher in March due to the infiltration difference. The infiltiration that happened in May was larger than March as the soil moisture content in March was high due to event happened just before the peak event while before May peak event it was dry for almost two months.
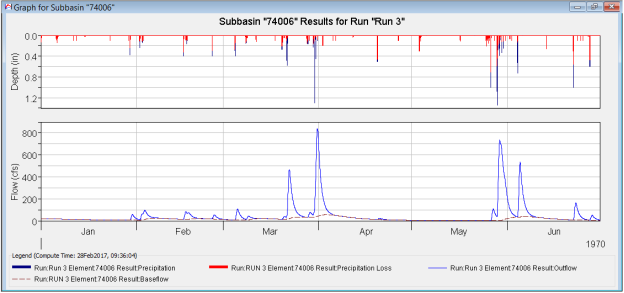
Figure 7 Hyetograph/Hydrograph of Sub-basin 74006
The hydrograph of the junction shown in Figure 7 shows the hydrograph coming from each sub-basin the blue dashed line and the total summation of all the hydrographs at the junction the blue line and the observed data the black dotted line. The dashed blue line and the solid blue line are coinciding because there is only on sub-basin that contribute to the junction. As shown in Figure 7, the observation and the hydrograph at the junction as almost the same which means that the parameters and methods used in the HEC-HMS are representing the reality quite well.
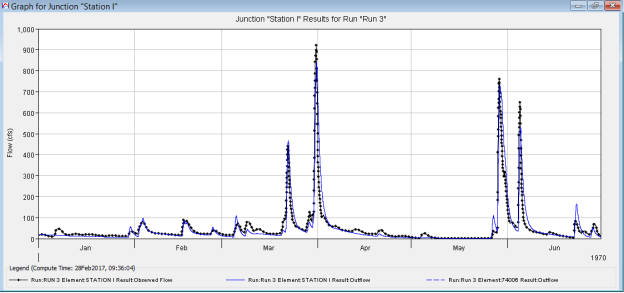
Figure 8 Hydrograph of Junction
HEC-HMS can simulate storm event to get the flow hydrograph of the catchment. It is important to use the adequate method based on the data availability. The model should be calibrated using the observed data. HEC-HMS can gives how each sub-basin can contribute to the basin outflow and what changes will happen if any of the sub-basin changes.
- Hydrologic Engineering Center (2010). Hydrologic Modeling System HEC-HMS, Quick Start Guide, US Army Corps of Engineers, Davis, USA
Cite This Work
To export a reference to this article please select a referencing stye below:
Related Services
View all


DMCA / Removal Request
If you are the original writer of this essay and no longer wish to have your work published on UKEssays.com then please click the following link to email our support team:
Request essay removal