A Template for a Business Plan
| ✅ Paper Type: Free Essay | ✅ Subject: Business |
| ✅ Wordcount: 2223 words | ✅ Published: 11 May 2018 |
Executive Summary
The executive summary of the business plan should summarise in such a way that the sections hang together all that has been included in the ensuing chapters. It should be a distillation of the plan itself – following the same order and pattern of the plan itself so that the reader may easily refer to a chapter for more detail if need be (Jenkin 2014). Depending on where the business currently stands – perhaps a start up or an established business looking to expand, the executive summary should highlight where the business is, where it needs to go, why it needs to go there, what it needs to get there and what can be expected to happen when the business does achieve its startup goals or expansion goals (SBA, 2015).
The Business
If the business is an established business, this section should detail the current position of the business. This should include the product mix offering, the customer segments or groups to which it is offered, the current financial position of the business, the current goals and objectives of the business (which should be Specific, Measurable, Attainable, Relevant and Time-limited), the current strategy of the business (i.e. the competitive advantage of the business) and finally how it currently utilises its resources (Evans, 2010).
Where the business plan is for a start up – this section should set out what the goals and objectives of the business would be again making sure that they are specific, measurable, attainable, relevant and time-limited. Furthermore this chapter should summarise the proposed product mix to be offered and the proposed customer segment or groups to whom it would be offered. The product mix must be presented in terms of its benefit to the proposed customer segments (Evans, 2010).
Market Demand
This chapter essentially details the results of the market audit or market research that should be carried out. The result of the market research presents the platform in which the markets can be defined; that is divided into segments, the target market is identified and the product offering is positioned (Barnett, 1988).
The first step thus is researching the market and business environment (Barnett, 1988). One way of determining market size is by adding the turnover of potential competitors (Evans, 2010). This can be done using a PESTLE analysis. A PESTLE analysis gives an overview of how key drivers such as the population, economic, socio-economic, technological, legal and environmental factors affect the market size and capability (Kotler and Keller, 2012)).

For example, if a start-up plans to begin the manufacturing and sales of a new smart phone in the UK, the population and the percentage of the population that uses a smart phone gives an estimate of the market size of smartphones. The population can be further broken down into age and sex segments to further narrow down the target in terms of the age brackets and sex of the market – this will inform the positioning of the product and the identification of the target market (Hooley et al, 2012). As can be expected a larger market size would be preferred (Kotler and Keller, 2012). The economic and socio-economic factors of the business environment or the market gives insight into the purchasing power of the market – again this should inform the target market and the positioning of the product. For example, if the economy is generally bad, consumers may not be willing to make high end purchases. Similarly, if the gross domestic product of a country is low, high-end products may not be suitable for the market. The technological, legal and environmental factors also affect the capability of the market to make a purchase or how the market now makes a purchase. In the smartphone example, perhaps it has become a trend that consumers now prefer “greener” phones, or the government has passed a law limiting the number of mobile phones one person can have or technological advancements now influence the kind of smartphones consumers want or the methods in which they purchase these smartphones – perhaps they now make more purchases online than they do in brick and mortar shops.
The information required to carry out this analysis can be found via the internet on sites such as Office for National Statistics UK which provides statistics on the population, the ratio of men to women across different ages and how much per household is earned in the UK amongst other relevant information. Alternatively or in addition, a customer survey using questionnaires may prove quite useful in determining the preferences of the market.
Having identified the market size, the next step would be to segment the market and identify the market in order to shape the product and value offering. The market can be segmented by geography, demography and behavior (Kotler and Keller, 2012). Having segmented the market thus, one of these segments or all of the segments could be identified as the target market. It is however worthy to note that a larger market segment with an equally attractive purchasing power may be the obvious preference but a niche may sometimes be found in a smaller or sometimes larger market with a low purchasing power. An example of this is insurance companies India, selling policies for as low as a pound because the population of India is quite large making it’s a large market albeit one with a low purchasing power (Kotler and Keller, 2012). It is recommended that a diagrammatic representation of the relevant information sourced for this section is included in this chapter of the business plan to make for easy reference of facts and figures.
Competition and Strategy
This chapter of the business plan should detail the industry attractiveness and the business strategy for competing in that industry. The attractiveness of an industry may be analysed and discovered by carrying out a Porter’s 5 forces analysis which essentially determines the profitability of the industry as determined by the 5 sources of competitive pressure (Grant, 2015), Porters’ 5 forces is diagrammatically represented below in Fig 1.
Threat of substitute products or services – The price customers are willing to pay for a product depends in part on the availability of substitute products (Gran, 2015). In other words, if there are no substitutes of the product or service one offer, customers may be inclined to pay a little more e.g cigarettes and gasoline. In addition the extent to which substitutes depress prices and profits depends on the likelihood of the buyer to switch between alternative products or services (Grant, 2015). For example, if customers are likely to switch from sugar to honey, then the prices and profits of sugar will fall in order to attract more customers.
Threat of Entry – If an industry earns a capital in excess of its cost of capital, it will act as a magnet to firms outside the business (Grant 2015). Put simply, if there are no restrictions on new entrants into the industry the rate of profit will fall towards the competitive level (Grant, 2015). In other words the more competitive the industry, the less profitable it is. Thus it will be worthy to check if there are barriers to entry in that industry such as high capital requirements, product differentiation, economies of scale, governmental and legal barriers etc. The more of these there are the less competitive and the more profitable the industry would be.
Bargaining powers of suppliers and buyers – This refers to whether the buyers are price sensitive or not and these would depend on a number of factors (Grant, 2015). For example in the car manufacturing and sales industry, it importance of a car usually outweighs its cost. Some cars are differentiated as luxury cars thus they are sold at a premium e.g Jaguar Land Rover’s Land Rover. Car manufacturers may have to be insensitive to price in a bid to get the important car parts they require in the manufacturing process, finally car manufacturers today are in intense competition with each other thus they put pressure on their suppliers to reduce prices. The same is the case for supplier bargaining power, except the roles are reversed and the firms in the industry are the buyers and the producers of their inputs are the suppliers.
Rivalry between firms would depend on the number and size of the rivals and whether they are relatively similar (Grant, 2015). If they are similar they may avoid price wars in favor of collusive pricing strategies. Also the extent to which the products are differentiated determines the intensity of competition – more differentiation means less competition and price cuts whilst the opposite is the case (Grant, 2015).
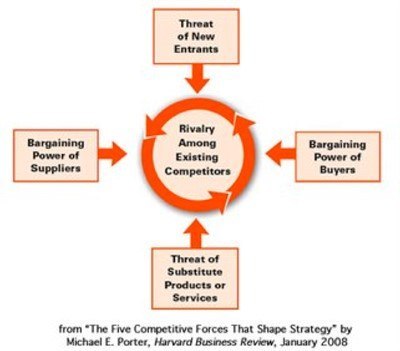
Fig.1 (Porter, 2008)
Having identified the intensity of competition in the industry and the target, the next step would be to identify a suitable strategy of value offering to the customers. In simple terms this could be either through product differentiation or price differentiation (Grant, 2015). Product differentiation strategy offers the consumers a product which benefits the consumer in a way no other product does whilst differentiation or cost leadership offers a price value which is below that offered by other suppliers or producers in the market (Grant, 2015). An example of a company with a cost leadership strategy is Primark.
Financials and Forecasts
There are a number of financial forecasts that could be created for the purposes of a business plan however the most suitable financial forecast for a start-up is a market driven sales forecast as it does not require the detail that a full financial forecast would require. A full financial forecast is more suitable for an already established business as historical financials of that business would be readily available.
It is worthy to note that a market driven sales forecast for a start-up will involve some general estimates which must be justifiable and realistic. A market driven forecast can be presented as shown below
| Business Segment or Customer Segment | Market Size | Market Demand Growth %/year | Forecast Market size(£000) in 3 years | Company competitive position on a scale of 0-5 | Likely market share Likely revenues | |
| A | Note 1 | Note 2 | Note 3 | Note 4 | Note 5 | Note 6 |
| B | ||||||
| C | ||||||
| Total |
Notes
- Note 1 – Assuming that the business has chosen segments that already exist in the market – the market size would be readily available by adding the turnover of potential competitors with the same segment. Otherwise a simple multiplication of the proposed price of the product by the size of the market (number of customers in the market) would suffice in estimating a market size.
- Note 2 – If it is an existing market, the information as to the growth trends of the market would be available on the internet (it is important to use a reliable source such Financial Times or Bloomberg). The average rate growth rate can then be used to predict the market growth rate for the next 3 years for each segment. Assuming that the growth rate remains constant makes it easier.
- Note 3 – To determine the forecast market size in the next three years, the, the growth rate of the market size over the last three years could be examined to arrive at an average figure which can then be used to forecast the market size in the next three years.
- Note 4 – The competitive position of the company in the next three years on a scale of 0 -5 (5 being the highest) may be determined by figuring out how much market share the company can realistically acquire in each year. For example if the company is starting up the fourth mobile phone network in a country that already has three, it is unlikely that the company would have a 25% market share in three years, rather it may have between 8-10% following an intensive marketing campaign (Evans, 2010).
- Note 5 – as explained in note 4.
- Note 6 Likely revenue should be informed by the market size divided by the market share and then multiplied by the price per unit of the product. The revenue forecast in 3 years’ time should be determined by the growth rate of the market and the market share of the company.
Control
Control involves a system of controlling an organisation’s expenditure over a period of time such as budgeting, variance analysis, and internal and external auditing (Evans 2010). However where a start-up is concerned, budgeting may be more suitable for controlling the expenditure of the company after its first year in business.
Funding
The following are the most popular and relevant sources of funding for a startup; self-funding, friends and family, small business grants, loans or line of credit, start-up incubator, angel investor, venture capital and partnership (Zwilling, 2010).
References
Barnett, W. (1988). Four Steps to Forecast Total Market Demand. Harvard Business Review. Retrieved 9 June 2015, from https://hbr.org/1988/07/four-steps-to-forecast-total-market-demand
Evans, V. (2011). The Financial times essential guide to writing a business plan. Harlow, England: Financial Times/Prentice Hall.
Grant, R. (2015). Contemporary Strategy Analysis (8th ed.). West Sussexx: Wiley and Sons.
Hooley, G., Piercy, N., & Nicoulaud, B. (2012). Marketing strategy & competitive positioning. Harlow: Financial Times Prentice Hall.
Jenkin, M. (2014). Small business tips: how to write a business plan executive summary. the Guardian. Retrieved 9 June 2015, from http://www.theguardian.com/small-business-network/2013/aug/22/small-business-tips-write-business-plan-executive-summary
Kotler, P., & Keller, K. (2012). Marketing management. Upper Saddle River, N.J.: Prentice Hall.
Porter, M. (2008). The Five Competitive Forces That Shape Strategy. Havard Business Review, 86(1), 78-93.
Sba.gov,. (2015). Business Plan Executive Summary | The U.S. Small Business Administration | SBA.gov. Retrieved 9 June 2015, from https://www.sba.gov/content/business-plan-executive-summary
Zwilling, M. (2010). Top 10 Sources Of Funding For Start-ups. Forbes. Retrieved 9 June 2015, from http://www.forbes.com/2010/02/12/funding-for-startups-entrepreneurs-finance-zwilling.html
Cite This Work
To export a reference to this article please select a referencing stye below:
Related Services
View all


DMCA / Removal Request
If you are the original writer of this essay and no longer wish to have your work published on UKEssays.com then please click the following link to email our support team:
Request essay removal