Data Classification Using a Machine Learning Package
| ✓ Paper Type: Free Assignment | ✓ Study Level: University / Undergraduate |
| ✓ Wordcount: 1181 words | ✓ Published: 25 Oct 2021 |
The Purpose of this report is to demonstrate the classification of Hazelnut as per three categories mentioned in dataset with the help of a suitable Machine learning package. This report covers all the basic points about how this classification is achieved:
- Machine Learning package
- Data Preprocessing
- Classifiers
- 10-fold cross validation
- Conclusion
- References
ML Package
We are going to achieve this classification with the help of Scikit in Python using Jupyter notebook. There are many reasons behind selecting this package:
1. Main objective is to learn and implement machine learning on Python as I want to pursue my data analyst career with Python as primary skill.
2. Scikit provides a range of supervised models where user does not have to write entire code for the classifier, but any algorithm can be imported from sklearn in addition of functions for data preprocessing and scaling.
3. It is very easy to prepare training and testing data sets via a consistent interface in Python. Example – Scikit has train_test_split function which split dataset into random training and test data.
4. Even Standardization of data for normal distribution among dataset can be done via importing a feature. Example – Scikit has StandardScaler which is used for normally distribute the data and scaling.
5. Display of results via confusion matrix and classification report is quite user-friendly which aids user to understand the findings of model.
Data Preprocessing
But before we use Scikit, SciPy (Scientific python) must be installed on interface.
Below are the steps which have been taken into consideration for preprocessing:
1. Dataset provided for the classification was in text format, so it has been converted into a csv format which is usually a predefined acceptable format worldwide and loaded data as dataframe.
2. All the attributes names were specified in the row and each column was specified as a record in dataset. So, to apply the models imported from sklearn, dataframe has been transformed. Other reason is optimization of code by simply adding one more line (of transpose) instead of adding another chunk to accept row as attributes name.
3. Data was not normally distributed, so with the help of Standard scaler function in scikit, it is preprocessed before feeding to the classifier.
Classifiers
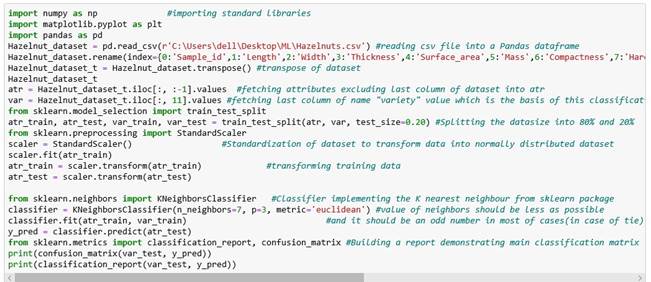
K-Nearest Neighbor
K-nearest neighbor belongs to supervised machine learning algorithms. It captures the idea that most of the time similar data points are closed to each other and it uses distance with mathematics to calculate nearest neighbors of data point. There are many prominent reasons behind choosing KNN classifier which are summarized in below points:

- We are using a small dataset and KNN considered perfect when we want to implement multi class problem with a small dataset.
- KNN is simple to comprehend and easy to implement.
- There are no assumptions needs to be met by data before it can be implemented which is the case with models like linear regression.
- User has flexibility to select distance (Euclidean, Manhattan, Minkowski, Hamming) while building KNN.
Below is the working model of KNN with indentations explaining all major steps:
And the output received is:
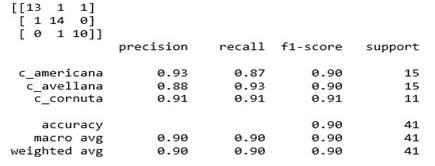
Here, matrix displayed in first section is confusion matrix which describe the performance of classifier. The column names are predicted values of c_americana,c_avellana and c_cornuta whereas rows signifies as actual value of c_americana,c_avellana and c_cornuta. It’s been clear that in a sample of 41 records, 13 records have been predicted positively in corresponds to 15 actual records of c_americana while c_avellana has a score of 14 out of 15 and 10 c_cornuta records are predicted yes in comparison of 11 actual records.
Second section of output gives a report of precision – accuracy of positive predictions, recall is ability of a classifier to find all positive instances and f1-score is weighted harmonic mean of precision and recall. In case of KNN classifier c_americana had precision of .93, c_avellana has .88 and c_cornuta had .91. And the number of correct decisions a classifier makes, divide by the total number of test records gives accuracy. Hence it is inferred from report that KNN is 90% accurate in predicting Hazelnut Variety.
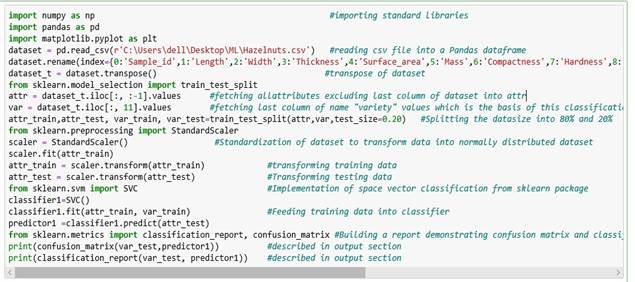
Space Vector Classifier
Space vector is also a supervised learning model which is used for both classification and regression problems. The objective of this classifier is to find a hyperplane in N features- dimensional space. Plane should have a maximum margin (maximum distance between data points of both classes) so that future data points can be classified with more confidence. There are many reasons for choosing SVM as second classifier which are specified below:
- This works well with small data sets and hazelnut comprises of 200 records.
- Real strength of SVM is kernel function. With an appropriate kernel function any complex problem can be resolved.
- Risk of over fitting is less in SVM compared to other models.
- And since data which needs to classified is not of high dimension. This seems to be an apt choice.
Below is the working model of Space vector with indentations explaining all major steps:
And the output received is:
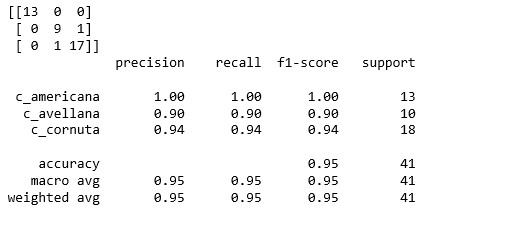
From Confusion matrix it’s safe to say that in a sample of 41 records, 13 records have been predicted positively in correspond to 13 actual records of c_americana while c_avellana has a score of 9 out of 10 and 17 c_cornuta records are predicted yes in comparison of 18 actual records. c_americana category of hazelnut has a precision of 1 while other two – c_avellana and c_cornuta has precision of 0.90 and 0.94 respectively. Therefore, we can conclude that Accuracy of SVM is 95% in classifying variety of Hazelnut.
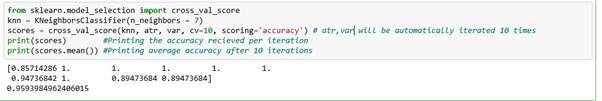
10-fold cross validation:
K- Nearest Neighbor
Space Vector Classification
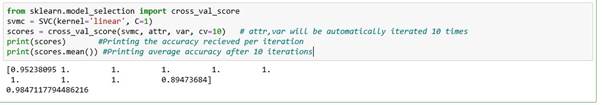
Above pictures depicts the result of 10-fold cross- validation on both models. KNN models predicted 100% accuracy 6 times while Space vector predicted 100% accuracy 8 times. Total accuracy of both models was 95.9% and 98.4% respectively. And if we look at individual behavior- KNN gave 90% which is approximately 5% less than its mean accuracy while Space vector was giving a difference of 3% with cross validation.
It is also important to mention here that if a user does not perform feature scaling (standardization of data) after splitting the dataset then accuracy in prediction is far more less than what we are getting right now. Example: in case of SVM accuracy is % which is far less than its accuracy i.e. 98% after performing cross validation.
Conclusion
In KNN, classification is based on nearby instances. These neighbors vote on the classification of the target. After implementation of KNN on Hazelnut dataset it’s been confirmed that in 90% of cases this model is predicting right variety of Hazelnut based on other features associated with it.
Space vector, on the other hand thrives on finding a hyper-plane separating the different classes of instances. It creates a large margin between datapoints. And as mentioned in feature scaling, after normalization of data, even SVM gives 95% accuracy which is greater than KNN. It indicates that dataset is easily separable using decision planes (after normalization) as basically SVM creates a fence between two classes, letting few instances on wrong side. Though they both gives similar kind of result after cross validation.
References
[1] https://towardsdatascience.com/support–vector–machine–introduction–to–machine–learningalgorithms–934a444fca47
[2] https://scikit–learn.org/stable/
[3] https://machinelearningmastery.com/k–fold–cross–validation/
Cite This Work
To export a reference to this article please select a referencing stye below:
Related Services
View all


DMCA / Removal Request
If you are the original writer of this assignment and no longer wish to have your work published on UKEssays.com then please click the following link to email our support team:
Request essay removal